Semantic Layer – What Is It?
The idea of the semantic layer was patented by Business Objects (pre-SAP), and developed into the SAP BusinessObjects semantic layer, also known as a Universe. The semantic layer concept addresses the gap between technological capability and technology usability. A semantic layer presents enterprise data in a user-friendly fashion to allow relatively non-technical business users to formulate queries against data sources to uncover answers to questions in a timely and consistent manner.
A semantic layer functions as middleware between your data sources and your BI and analytics platforms, providing virtualized connectivity, modelling, and other data manipulation capabilities. Because all BI and analytics data is filtered through this semantic layer, all BI and analytics users see the same data in the same way.
Essentially, a semantic layer functions as middleware between your data sources and your BI and analytics platforms, providing virtualized connectivity, modelling, and other data manipulation capabilities. Because all BI and analytics data is filtered through this semantic layer, all BI and analytics users see the same data in the same way. All users see a single version of the truth, use the same measures and dimensions, and report on the same reality.
Without a semantic layer, self-service analytics is very difficult, and answers to important business questions are less timely. As the volume of data grows exponentially, the complexity of data sources grows to keep pace. Enterprise information now generally resides in large databases, data warehouses, applications’ internal storage, cloud services and data lakes, as well as other data source types and appliances. The expertise needed to extract this data and distill it to meaningful information is the realm of data scientists, highly trained DBAs, and other IT personnel. A semantic layer makes this data universally accessible to business users while hiding the complexities of data retrieval and linking. Retrieval and linkage still need to be managed by highly trained personnel but once the semantic layer is built, business users can serve themselves, accessing data described in business terms.
To understand the importance and merits of deploying a semantic layer, it is important to understand the following topics, and how they relate to the semantic layer:
Data Integration
 The history of data storage, from comma-delimited flat files, to relational databases, to OLAP cubes, to data warehouses, to data warehouse appliances, to in-memory and columnar data sources, to cloud-based storage, is the quest to provide the information that gives enterprises better competitive advantage and a longer competitive advantage period. In this quest, the freshness of data is paramount.
The history of data storage also mirrors the history of the enterprise itself. Technology has allowed information flow within enterprises to become largely seamless, but getting there has been a long data integration process. When enterprises existed as sets of silos, largely isolated from each other, so too did their data storage strategies.
A semantic layer is a form of data integration providing easy access to the data by business users. A semantic layer enables self-service analytics for a broad audience by removing the need to know how the data is structured and linked, and by describing the data in familiar business terms. A semantic layer enables faster time to value on important business questions, and reduces the reliance on IT or other specialized technical staff.
A semantic layer enables self-service analytics for a broad audience by removing the need to know how the data is structured and linked, and by describing the data in familiar business terms.
Data Warehouses
Integrating siloed data was key to the development of the modern, responsive enterprise, and the development of the data warehouse made that integration possible. Data warehouses brought data from the individual business silos into a single repository and enabled a comprehensive view of the enterprise’s activities.
Early on, in many cases, data warehouse deployments were not as successful as their corporate sponsors had hoped. There are many reasons for such failures, but the critical one is failing to realize that a data warehouse is not a technology project, but a business project enabled by technology. It is a failure of vision – a failure to understand what, precisely, a data warehouse is for. Focusing on what a technology can do, rather than what business users need, is a recipe for failure.
Data Warehouse Appliances
Data warehouse appliances package hardware and software integrated to achieve high performance analytics with large quantities of data, generally through massively parallel processing. The preconfigured and optimized software/hardware integration makes data appliances relatively easy to implement, and resolves scaling issues for data analytics.
While many examples of the concept of the data warehouse appliance and its architecture date back to the 1980s, the technology emerged in the early 2000s in answer to the exponential growth of data.
The trade-off for the processing power and usability provided by data warehouse appliances is the implementation cost and the maintenance cost over time, which is one reason that cloud-based data management solutions have become more popular with organizations that have growing and evolving big data needs.
In-Memory Databases
Traditional relational and OLAP database management systems are generally only as fast as the amount of RAM and parallel processing capabilities available to access disk storage. In-memory database systems take this observation to its natural conclusion by providing large amounts of volatile memory in which your data resides. This volatile memory improves the availability of large amounts of data making such database systems ideal for functions where response time is critical.
Columnar Databases
Columnar databases are another means of speeding access to data. The approach of columnar databases to your data is, as the name implies, oriented to columns rather than rows. Traditional, row-based databases reflect the way that data is entered into a system, while columnar databases reflect more closely the way that data is retrieved from a system by analytical queries. If you want to review sales numbers across regions, you don’t need the rest of the information stored in the rows representing the individual regions.
Big Data, Hadoop, Data Lakes
Big data has come to stand for a combination of many data storage and management concepts and characteristics. Its aim is to focus on what are known as the 3 “Vs:” volume, variety, and velocity. Volume, because organizations typically deal with terabytes and petabytes of information; variety, because analytics demands access to structured, unstructured and semi-structured data; and velocity, because predictive analytics are not just about what will happen next year, but also about what will happen this afternoon.
The term “big data” has been around since the 1990s, and it generally refers to any database management system using a set of techniques, including parallel processing, to process queries quickly against large volumes of data.
Apache Hadoop is a specific flavor of big data that uses a collection of open-source software utilities to create a software framework for distributed storage and processing of large volumes of data, generally across server clusters. Facebook began using Hadoop in 2010, and by 2012, data on Facebook servers was growing by approximately half a petabyte every day.
Data lakes were named in contrast to data marts, which were smaller collections of data insights from raw data. Data lakes contain all of the raw data from which such insights were derived, including structured, unstructured, semi-structured, and binary data such as images, videos, and audio. While data lakes can be created on premise, it is in the cloud that data lakes are finding their greatest application, because organizations do not have to up-size their infrastructure continuously to accommodate data growth. The cloud provides performance and scalability on a managed platform.
Data Freshness – Downloaded vs. Live
 Early analytics applications and reporting tools would require users to download data to the desktop or capture an instance of the data on a server before analyzing. Once data has been downloaded, analytical processing could be quick, but the amount of data that it was practical to download was limited. The data sample was not large, and the data is no longer current, but these analytical applications provided what was needed for operational intelligence, but were not a source of predictive analytics or “what-if” scenarios.
OLAP (Online Analytic Processing) marked an advance in analytics, placing analytic processing within the database management system itself. Data access was quick, but not current, as OLAP requires data preprocessing. OLAP servers pre-summarize the data with all the possible permutations so it is instantly available to the user. It takes considerable time to construct OLAP cubes and a lot of space is needed for storage. There have been several flavors of OLAP:
- MOLAP – everything preprocessed
- ROLAP – nothing preprocessed, and summaries were built on the fly, meaning lower disk storage requirements, but slower response times
- HOLAP – a hybrid scenario in which lower level summaries are not built to save disk space
As successful as data warehouses have been at aggregating data into a single repository, there are a couple of very significant drawbacks: they do not provide real-time data access, and the data that they do provide may be summary in nature, not allowing as much drilldown analysis as would be available in the original (raw) data source.
Data warehouses use an ETL process (Extract, Transform, Load), which copies data from its original data sources, massages it to fit the data warehouse’s data modelling needs, and loads it into the data warehouse. While data warehouses increase the volume of data available for analysis, as well as the velocity of analytical processing, they do not provide real-time access to data. As time moves forward from the ETL process, business users may have diminishing confidence in the freshness and accuracy of the data with which they are working.
Truly responsive and live data analytics were made possible with the introduction of in-memory database solutions such as SAP HANA, and now it is possible to achieve live, responsive data analytics with big data in large in-cloud data lakes such as Google BigQuery and Snowflake.
Example of achieving live responsive data analytics with big data in large in-cloud data lakes, such as Google BigQuery and Snowflake:
Truly responsive and live data analytics were made possible with the introduction of in-memory database solutions such as SAP HANA, and now it is possible to achieve live, responsive data analytics with big data in large in-cloud data lakes such as Google BigQuery and Snowflake. Some features and calculations are only available for downloaded data, but more and more can be done now with a live connection to fast databases.
Moving petabytes of data to a single data platform may be desirable from a data integration point of view, but the current proliferation of data sources has happened for a reason, which is that database management system development tends to be purpose-driven. Sometimes that purpose is a specific application, and data is stored in the way that makes that data most accessible to the specific application. That data can be extracted to data warehouses or data lakes, but then it is no longer live data.
Single Version of the Truth
 The expression "single version of the truth" may seem like an oxymoron, in that truth is generally regarded as monolithic. That is, truth is truth, and there are no versions. However, organizations need to define and delimit the data to ensure analysts are working with the same units of measure, the same timeframe, and that data is weighted appropriately for the purposes of the business. To have a single version of the truth, organizations must ensure that all information is delivered from the same perspective, which means that different analysts are not deriving insights from different data sets.
Similarly, it is often said that honesty is the best policy, but honesty is really the absence of policy. Policy is required to organize data into information that analysts can use to derive insights. Policy defines the single version of the truth. Policy defines what is useful.
The search for the perfect data warehouse and the way to deliver it is really the search for a way to provide a single version of the truth to the business. That version is a single representation of the true state of the business so that all stakeholders can rely on it for business decisions. The essential point is that analysts need consistent data or their analyses and visualizations may become apples and oranges, to the detriment of business decisions.
Analysts need consistent data or their analyses and visualizations may become apples and oranges, to the detriment of business decisions.
Providing a semantic layer to your business analysts is a way of ensuring that they are all operating from a single version of the truth. The semantic layer offers universally defined business terms like gross margin or direct revenue to be used by all business users to see the business from the same point of view.
Security

Storing all of your data in large repositories provides great accessibility, but it also presents security issues, including:
- Ensuring business data can only be seen by the appropriate users
- Not securing too much so that data remains available to users operating the business and making business decisions.
- Securing private or sensitive data per regulatory requirements (e.g.: HR/employee data, customer data, patient data), and ensuring the ability to audit the use of data.
- Ensuring the ability to examine data lineage to verify the validity of data, that the definition of the data has not changed over time, and to be able to trace errors to their origins.
Data Modelling
 Building a data model for a data warehouse is a complex task that requires deep knowledge of the data and data modeling theories. These projects usually take a long time to plan and construct, and are typically a collaboration between IT personnel and data analysts. The length of time it takes to construct such data models can impact business agility negatively as business decisions cannot wait. Data models evolve over time, because the needs of the business change. When data modelling is an IT process, there is generally a backlog requiring prioritization, which may not match the priorities of individual analysts.
In-memory databases, data lakes, and cloud solutions have improved the time to value for data models by enabling more ad-hoc data modeling and ad-hoc querying of business data to keep up with the fast pace of change in business.
A well developed semantic layer provides opportunities for fast ad-hoc data modeling and ad-hoc querying of data from multiple sources, as well as the ability to share data models and queries with the appropriate information consumers. Ad hoc data modelling can create governance difficulties, especially in highly regulated industries or when certain elements of an organization’s data are sensitive.
Data Virtualization
 An enterprise data landscape may consist of numerous data sources and data source types that are populated with data from a variety of operational and transactional systems. Data virtualization is a middleware function that allows BI and analytics users to access that data without moving it or creating a new physical data platform.
One of the greatest advantages of data virtualization is that it removes the need for database drivers to be installed, configured and maintained on individual workstations. Instead, you need only update the middleware with revised or new drivers for new data sources. Updating drivers on individual workstations every time a new driver is created would be a significant drain on IT resources. Data virtualization is a means of future proofing data access. When data sources are added to the landscape, you need only make changes in the middleware and the changes are immediately available to the user community.
A well developed semantic layer employs data virtualization to connect BI and analytics users to the data sources they need for their analyses while ensuring all these analytics users receive the same data access, creating a single version of the truth shared by all.
Data virtualization, if not handled properly, may cause performance and security issues. A semantic layer must be designed from the ground up to address these issues.
Example of building a connection, creating a data model and connecting to live data:
ETL to the Cloud vs. Live Access
 For BI and analytics purposes, having all of your enterprise data in a single data source is a winning proposition, which is why data warehouses were created in the first place. However, this is not how data is generally created. Data in a data warehouse goes through an ETL process to be made available to analysts.
As businesses continue to move to cloud services, the need to upload greater quantities of data to the cloud service increases. Moving data to the cloud requires a significant data remodeling effort, as well as a rebuild and synchronization of security models. In addition, some data sources may be too large (e.g., data lakes), or they may change too rapidly, to be moved practically.
Certain kinds of analytics (e.g., predictive) need the data they use to be uploaded, but this is not true of all, or even most, analytics services. Most analytical services do not need data uploaded to the cloud service. Instead, using a semantic layer, they can stream the data live from its original source, saving significant time and IT resources.
Using a semantic layer to live stream data from its original source rather than accessing acquired data in the cloud removes the need to remodel data and security. The data remains in its original data source, behind the corporate firewall, and the semantic layer serves it to the individual analyst’s desktop.
Data Blending
 The great virtue of a semantic layer is that it can provide access to all of your enterprise data, but this is also the source of one of the semantic layer’s greatest potential pitfalls. Because a semantic layer virtualizes data connectivity and combines data from multiple data siloes within an organization, it creates a need for data blending. Data blending is the activity that ensures BI and analytics users are seeing data consistently across data siloes.
A potential pitfall of data blending is security. Each data source has its own security model, but the blended data must present a single security model to the user. The original data sources may vary on issues such as row-level security, and data blending needs to respect the security model of each data source. If you are planning a single-sign-on (SSO) strategy, you need consistent credentials across data sources.
When you bring together data from different sources, you need to cleanse and synchronize the data in its granularity. There are three scenarios through which you can achieve this requisite data blending.
- In a live data blending scenario, middleware blends the data without moving it from its original source and delivers it via the semantic layer. The middleware passes credential, leveraging and respecting the security established in the data sources.
- In a data warehouse data blending scenario, the siloes of data are extracted from the data siloes, transformed by a process of cleansing and data modelling, and loaded into a data warehouse, providing a single point of access for users with its own data security model.
- In a hybrid data blending scenario, live data access is combined with automatic caching capabilities for data blending performance gains. This technique is useful when the amount of live data blending is taxing on available RAM and CPUs. You can control the amount of caching to balance performance and storage allocation for optimal query processing speed.
While data blending may not be part of the semantic layer’s mandate, a semantic layer is expected to give you a unified view of your data, so data blending must be a major consideration in planning your deployment.
Governance
 Finally, as with all technology implementations corporate governance and regulatory compliance should not be afterthoughts, but by design when you plan your deployment and select its constituent technologies. Your deployment should consider whatever means are at your disposal to:
- Control what the user can see, and not give direct access to the original data. All data access is shunted through the semantic layer to ensure proper data governance.
- Contain row level security and user control. The semantic layer is a unifying layer for security and modeling against multiple data sources.
- Permit audit of the data accessed by users at the SQL level or at the field level to maintain highly governed and regulated data systems.
- Provide version control
- Provide data lineage
This list is not comprehensive, and each item on the list could be its own discussion paper.
Example of data governance and control:
Summary
In this article, we have looked at:
- Data Integration – A semantic layer is a form of data integration providing easy access to the data by business users.
- Data Freshness – For the most accurate analytics, data needs to be as fresh as is practical.
- Single Version of the Truth – Information is delivered to users from the same perspective, using the same criteria, so that different analysts are not deriving insights from different data sets.
- Security – Users should only see the data they are entitled to see, and sensitive or private data is protected.
- Data Modelling – A well developed semantic layer provides opportunities for fast ad-hoc data modeling and ad-hoc querying of data from multiple sources.
- Data Virtualization – A middleware function that allows BI and analytics users to access enterprise data from multiple sources seamlessly without the need to install and configure connectivity to each source for each user.
- ETL to the Cloud or On-Premise vs. Live Access – Using a semantic layer to live stream data from its original source rather than using an ETL process to load the data into a warehouse on premise or in the cloud first. Removes the need to remodel data and security.
- Data Blending – The activity that brings together data from different sources to give a unified views of the data. Ensures BI and analytics users are seeing unified data consistently across data siloes.
- Governance – Corporate governance and regulatory compliance should not be afterthoughts, but by design when you plan your deployment and select its constituent technologies.
Thought Leadership
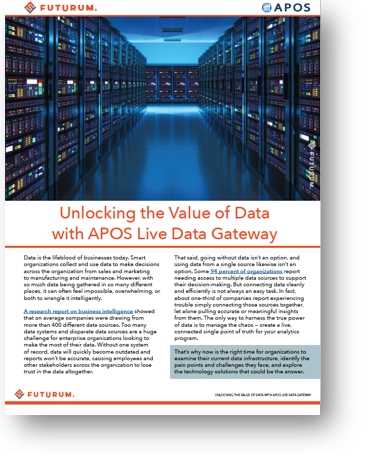
Futurum Research Insight
Unlocking the Value of Data
with APOS Live Data Gateway
SAPinsider Video Q&A
The Importance of Seamless Data Connections
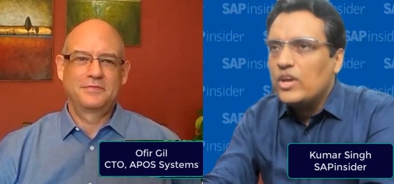
Video interview with with Kumar Singh, Research Director, Automation & Analytics, SAPinsider and Ofir Gil, CTO, APOS Systems
Market Insight - SAPinsider Research
Leveraging Data Connection Gateways to Harness Full Value from Analytics Investments
To learn more about implementing or improving semantic layers in your organization, contact APOS and speak to one of our semantic layer experts.
The videos on this page will also help you to understand how APOS technology and the APOS Semantic Layer can help you build a unified semantic layer.
Learn more about: